DALLAS, May 22, 2025 (GLOBE NEWSWIRE) -- Texas new home sales jumped last month, and prices ticked up while Days on Market barely budged, according to the newest monthly Texas New Home Sales Report released today by HomesUSA.com and its founder and CEO, Ben Caballero, the nation's top-ranked real estate agent.
The HomesUSA.com New Home Sales Report uses Multiple Listing Service data – the most comprehensive, current, and accurate information – from the Realtor Associations of North Texas, Houston, Austin, and San Antonio. All averages in the monthly report are based on three-month rolling averages to reduce short-term volatility and anomalies.
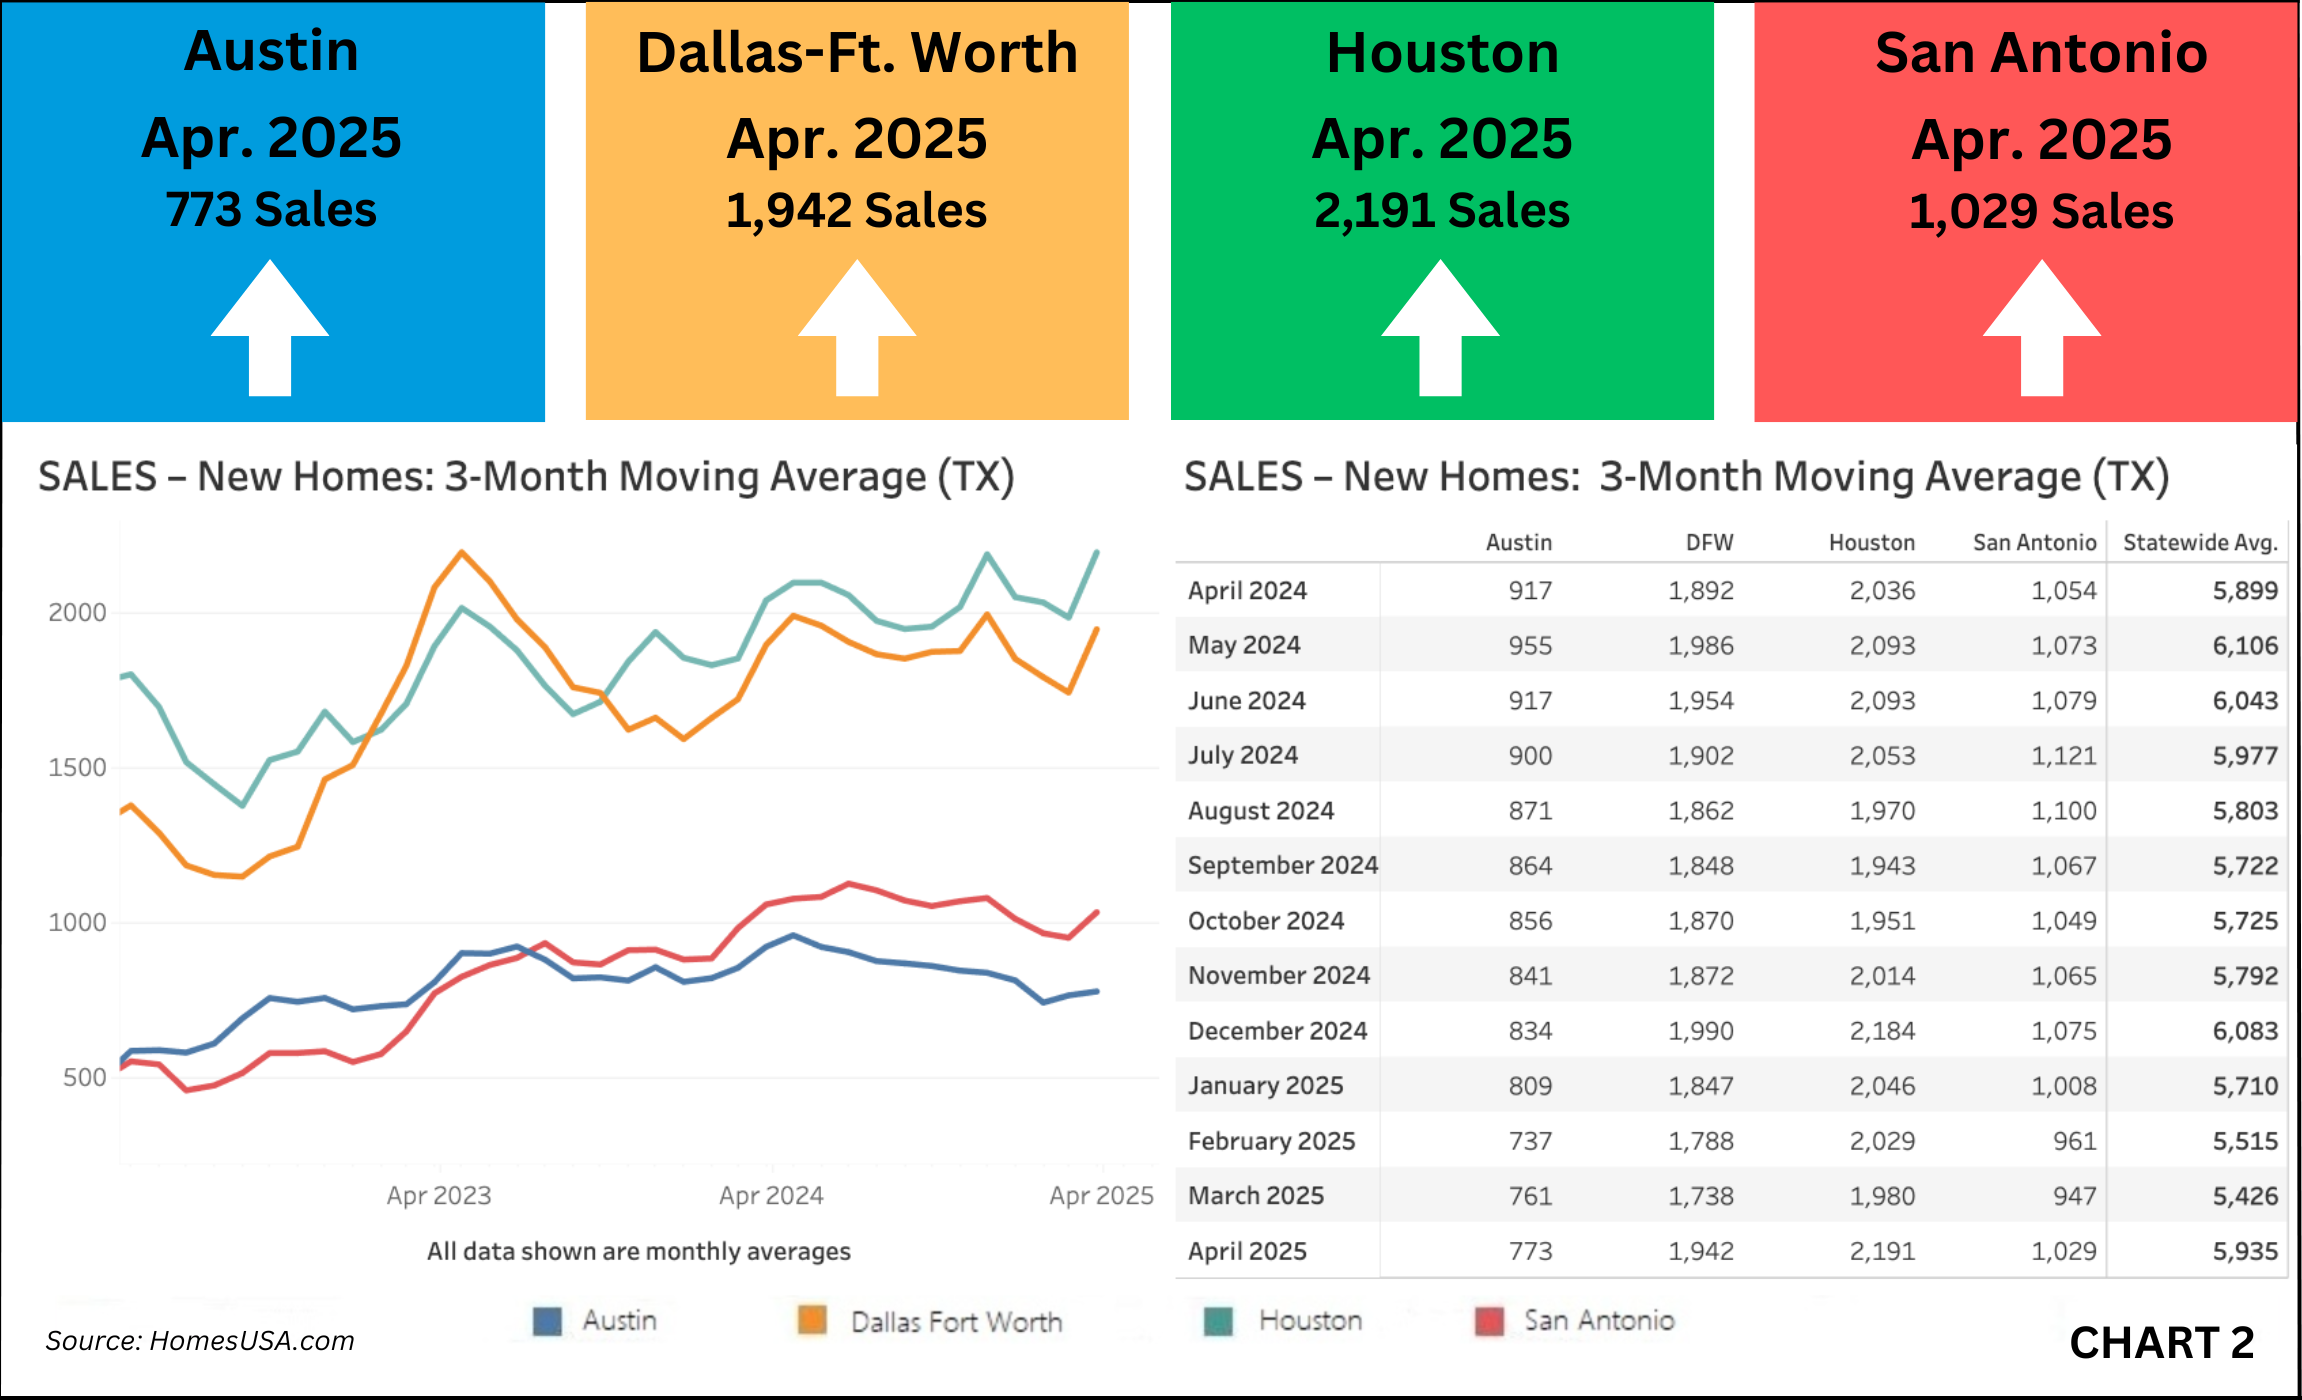
HomesUSA.com reports April new home sales in Texas was up over 9%, with the statewide average at 5,935, up from 5,426 in March. Among the major metros, Dallas-Ft. Worth new home sales jumped 11.7% in April, Houston was up 10.7%, San Antonio was 8.7% higher, while Austin had a marginal monthly increase of 1.6%.
"In April 2025, U.S. mortgage rates experienced a modest improvement, offering slight relief to prospective home buyers, and that helped Texas' new home sales improve," said Ben Caballero, founder and CEO of HomesUSA.com.
"All market indicators are positive, and the data tells us consumer confidence is improving," added Caballero. "I like what I'm seeing, and it appears that better times are coming for home builders. If we see an interest rate drop – and I believe we will – it'll be off to the races. Smart home shoppers will buy now before things heat up."
According to HomesUSA.com’s proprietary Texas New Home Sales Index, Days on Market – which measures how fast new homes sell barely budged in all four of the state’s largest new home markets last month, with the statewide average at 112.56 days in April versus 111.52 days in March.
![]()
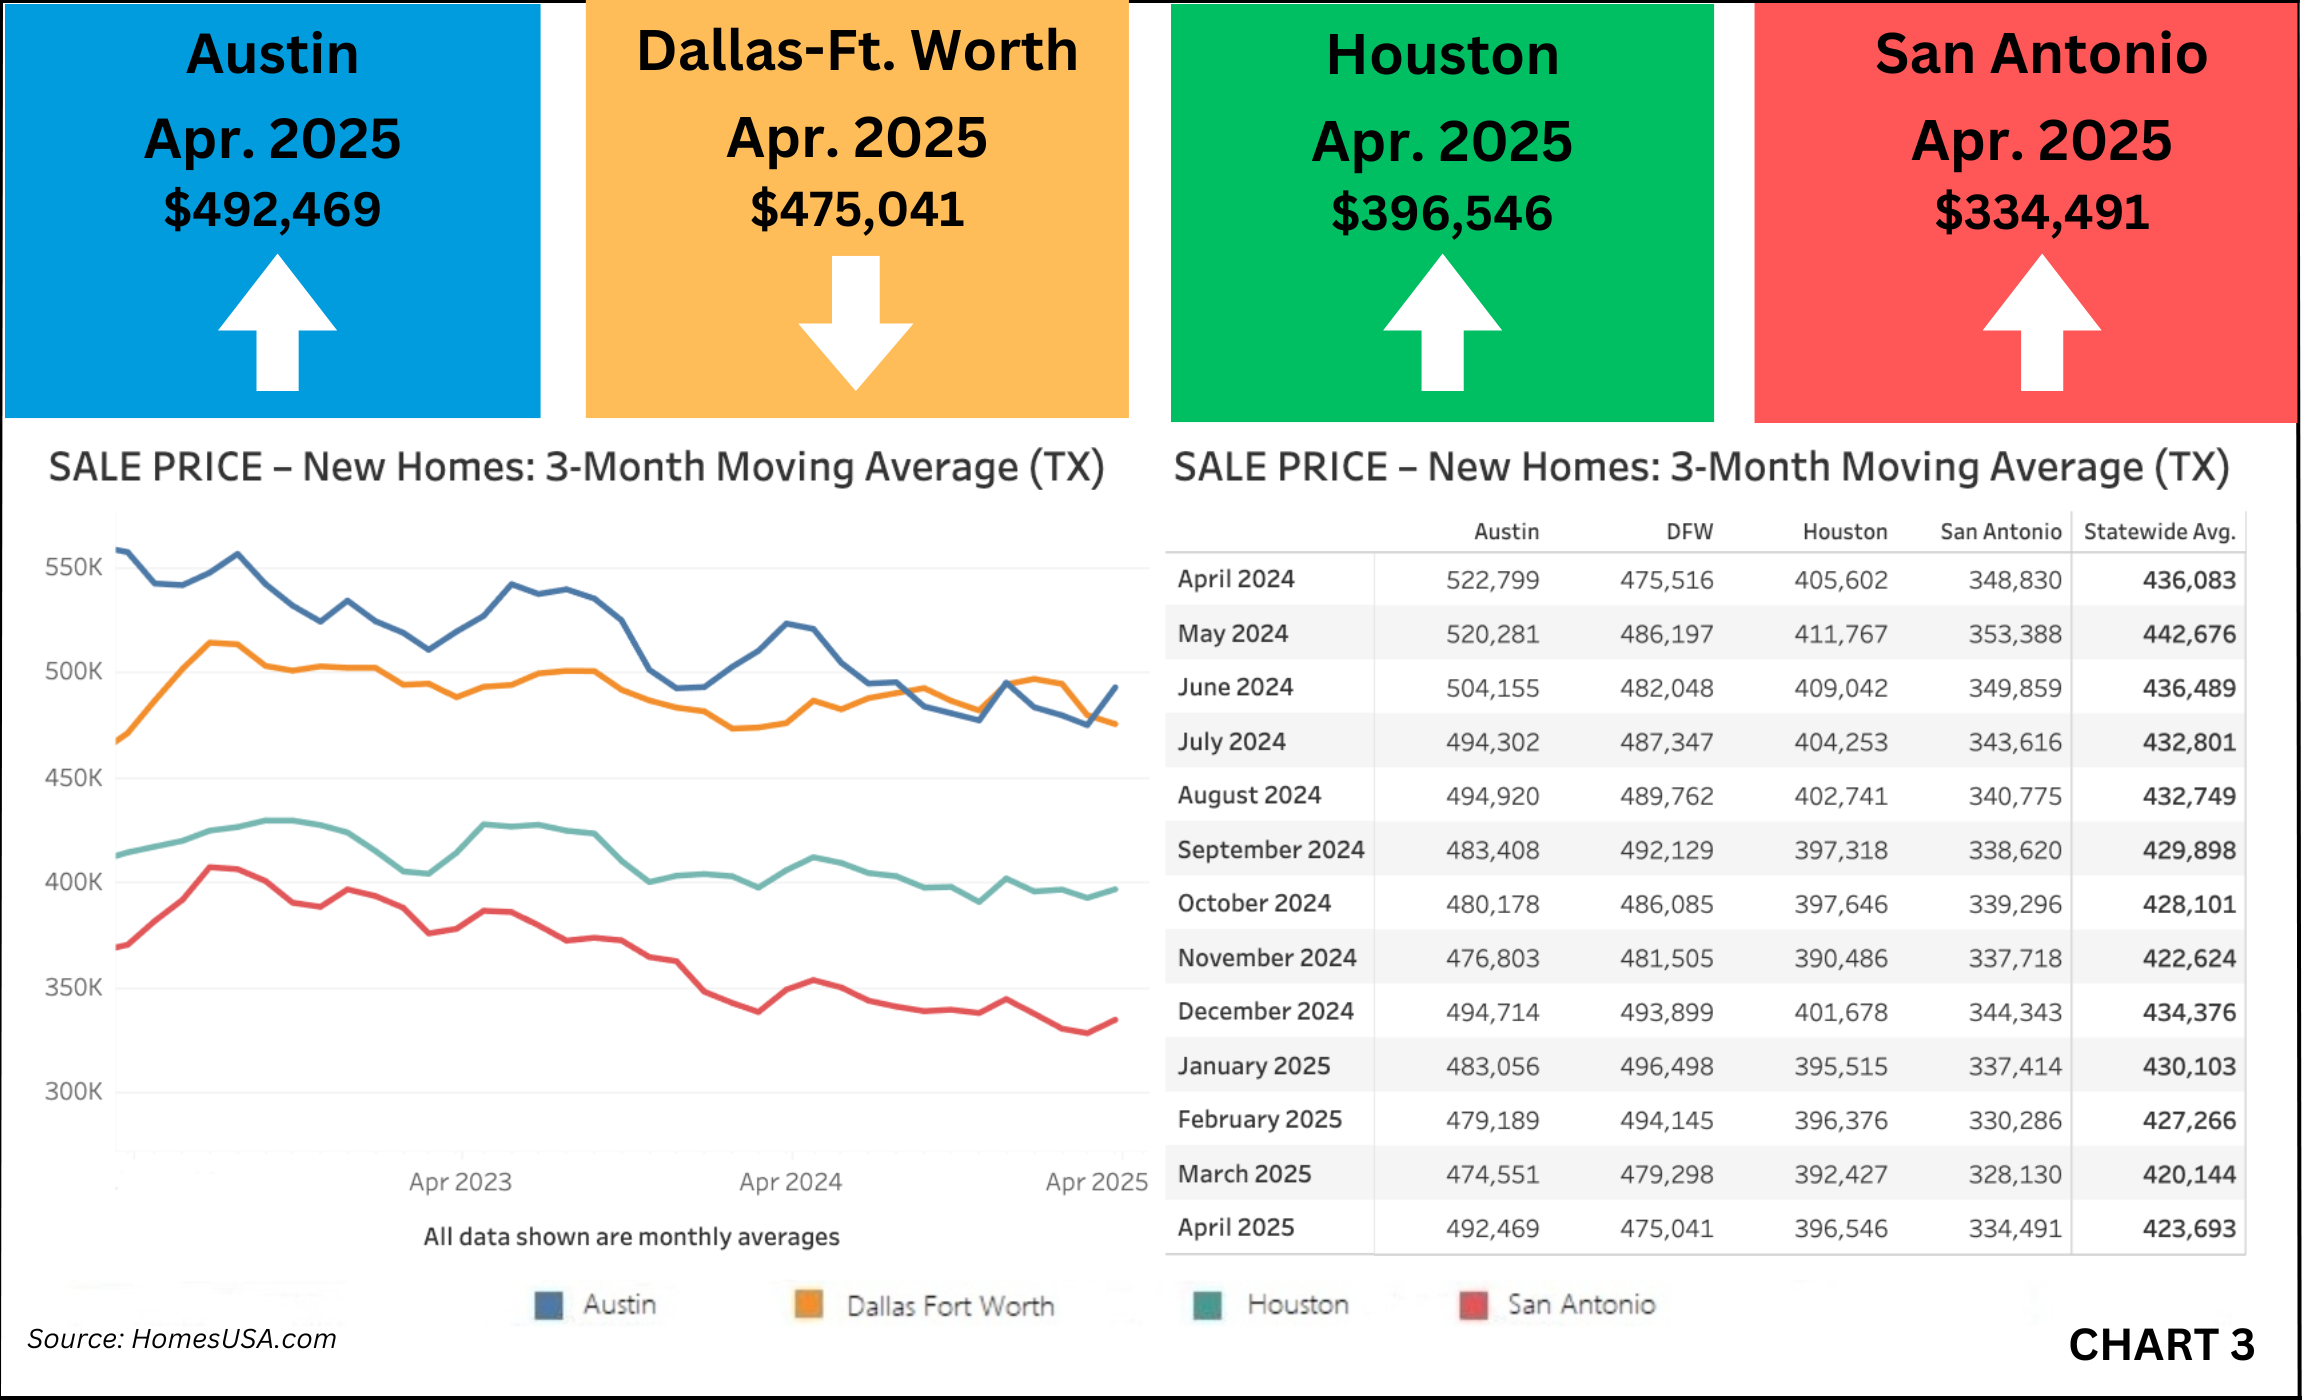
Last month, the average new home prices rebounded a bit last month in three of the four largest Texas new home markets, ticked up statewide to $423,693 versus $420,144 in March.
Austin had the biggest price increase to $492,469 versus $474,551 in March. Houston’s new home price average was $396,546 versus $392,427 in March, and San Antonio’s was $334,491 versus $328,130 in March. In contrast, Dallas Ft. Worth’s new home price average dropped to $475,041 from $479,298 in March.
Austin retook the title of the highest average new home price in the state’s major metro areas, overtaking Dallas-Ft. Worth, which held the title all year.
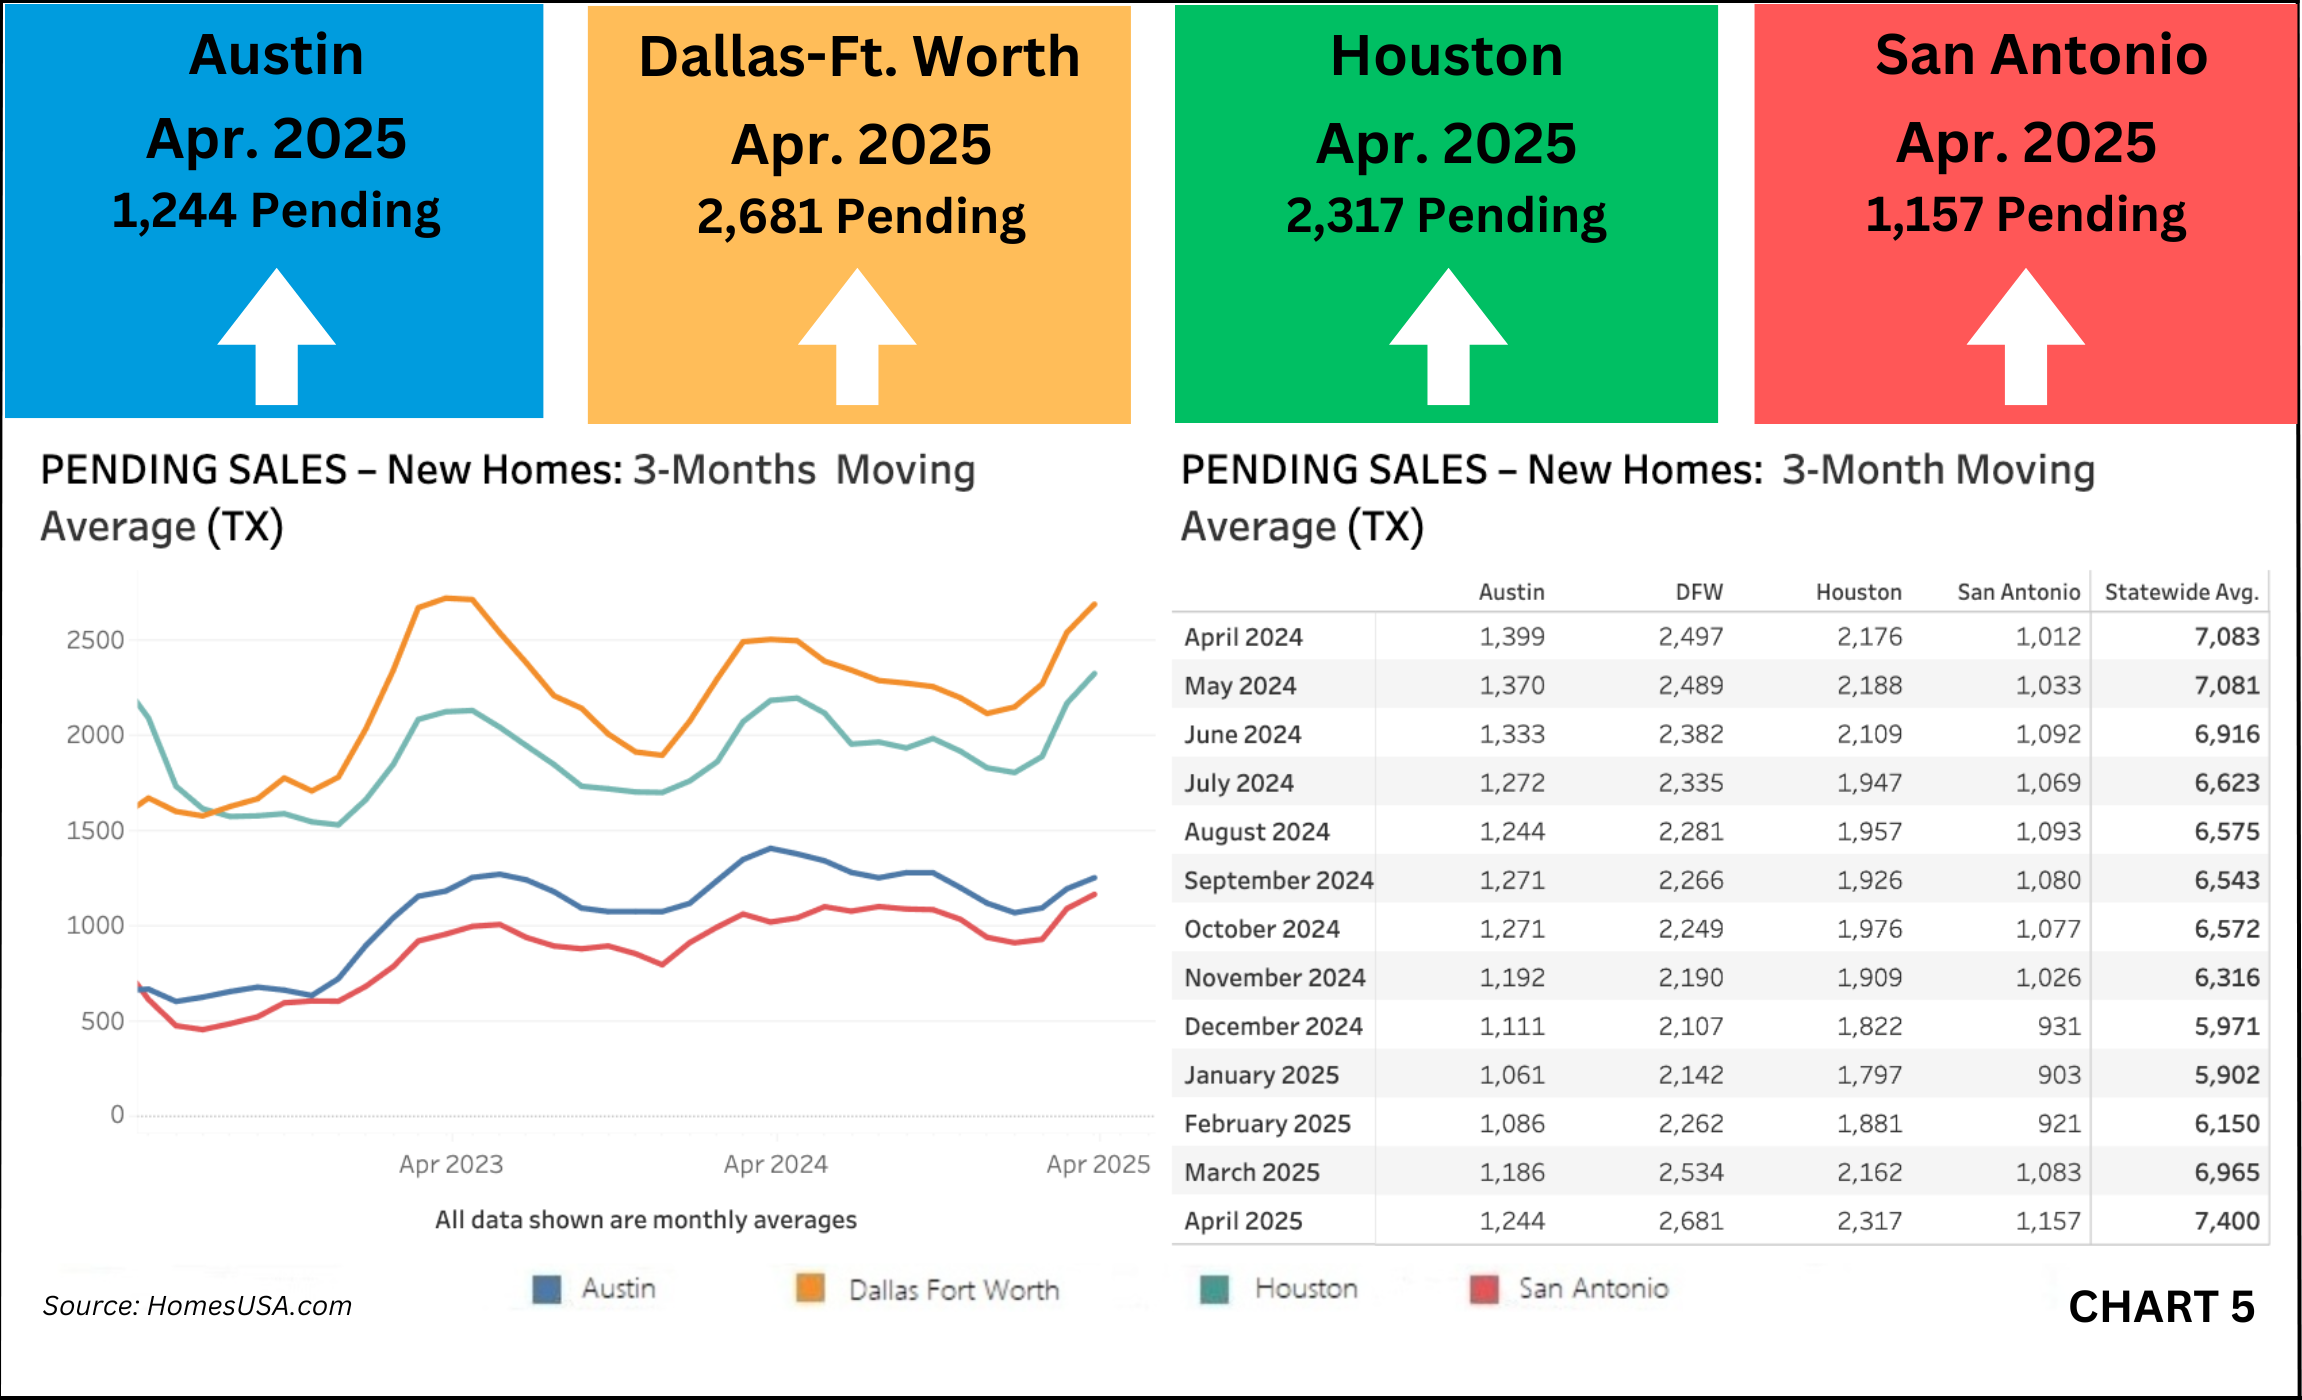
Pending new home sales last month – a key future sales indicator – continue to rise in April. The statewide average added more than 400 new units to April pending sales of 7,400 versus 6,965 in March.
Houston had the most significant pending sales increase to 2,317 from 2,162 new homes in March while Dallas-Ft. Worth was up to 2,681 from 2,534 last month. San Antonio climbed to 1,157 from 1,083 in March and Austin saw an increase with pending sales in April of 1,244 versus 1,186 in March.
Active new home listings in Texas’s four largest markets were relatively flat across the board in April, indicating stable housing inventory. Statewide, the April average of active listings was marginally higher at 33,142 versus 32,941 in March.
Houston was the anomaly as April active listings increased to 14,032 versus 13,826 in March. The rest of the major metro areas were flat: Austin was 5,748 versus 5,712, Dallas-Ft. Worth was 8,160 versus 8,230, and San Antonio was 5,203 versus 5,172.
HomesUSA.com is sharing its New Home Sales Report and New Home Sales Index at the same time the Commerce Department releases its nationwide New Residential Sales Report for April, set for Friday, May 23, 2025, at 10:00 am Eastern time.
About the Report
The HomesUSA.com monthly report covers closed sales recorded in MLSs by the 10th day of the following month. The report features 3-month and 12-month moving averages for six essential market data, including DOM, sales volume, sales prices, a sales-to-list price ratio, pending sales, and active listings. Caballero explained the 3-month moving average indices track market seasonality, while the 12-month moving average removes the seasonality and tracks the longer trend.
Days on Market Flattens – New Homes in Texas (Exclusive Data)
The HomesUSA.com New Home Sales Index showed that the DOM's April 3-month moving average continued to flatten in Texas’ four major new home markets. In Dallas-Ft. Worth, the DOM was 148.18 days versus 148.47 days in March. In Houston, the DOM was 93.86 days versus 92.51 days in March. In Austin, the DOM in April was 105.52 days versus 105.95 days in March. In San Antonio, the DOM was 91.19 days versus 88.74 days in March. New homes have significantly higher DOM than existing homes because most new homes are listed while under construction. Note: Each MLS may calculate Days on Market differently, so direct comparisons may not always be reliable. (See Chart 1: Texas New Homes Days on Market)
Texas New Home Sales Increase
Based on all local MLS data, the most reliable and current source of all home sales activity, total new home sales increased in the four largest new home markets in Texas last month. The April 3-month moving average of new home sales in Dallas-Ft. Worth was 1,942 versus 1,738 in March. In Houston, total new home sales in April were higher at 2,191 versus 1,980 in March. In Austin, new home sales last month rose to 773 versus 761 in March. In San Antonio, new home sales in April were also higher at 1,029 versus 947 in March. (See Chart 2: Texas New Home Sales)
Texas New Home Prices Rise
The average prices of new homes rose in three of the four major new home markets in Texas last month. In Houston, the 3-month moving average price for new homes in April was $396,546 versus $392,427 in March. In Austin, the 3-month moving average price in April was higher at $492,469 versus $474,551 in March. San Antonio's average new home price in April was also higher at $334,491 versus $328,130 in March. Dallas-Ft. Worth was the exception, as the average new home price in April was lower at $475,041 versus $479,298 in March. (See Chart 3: Texas New Home Prices)
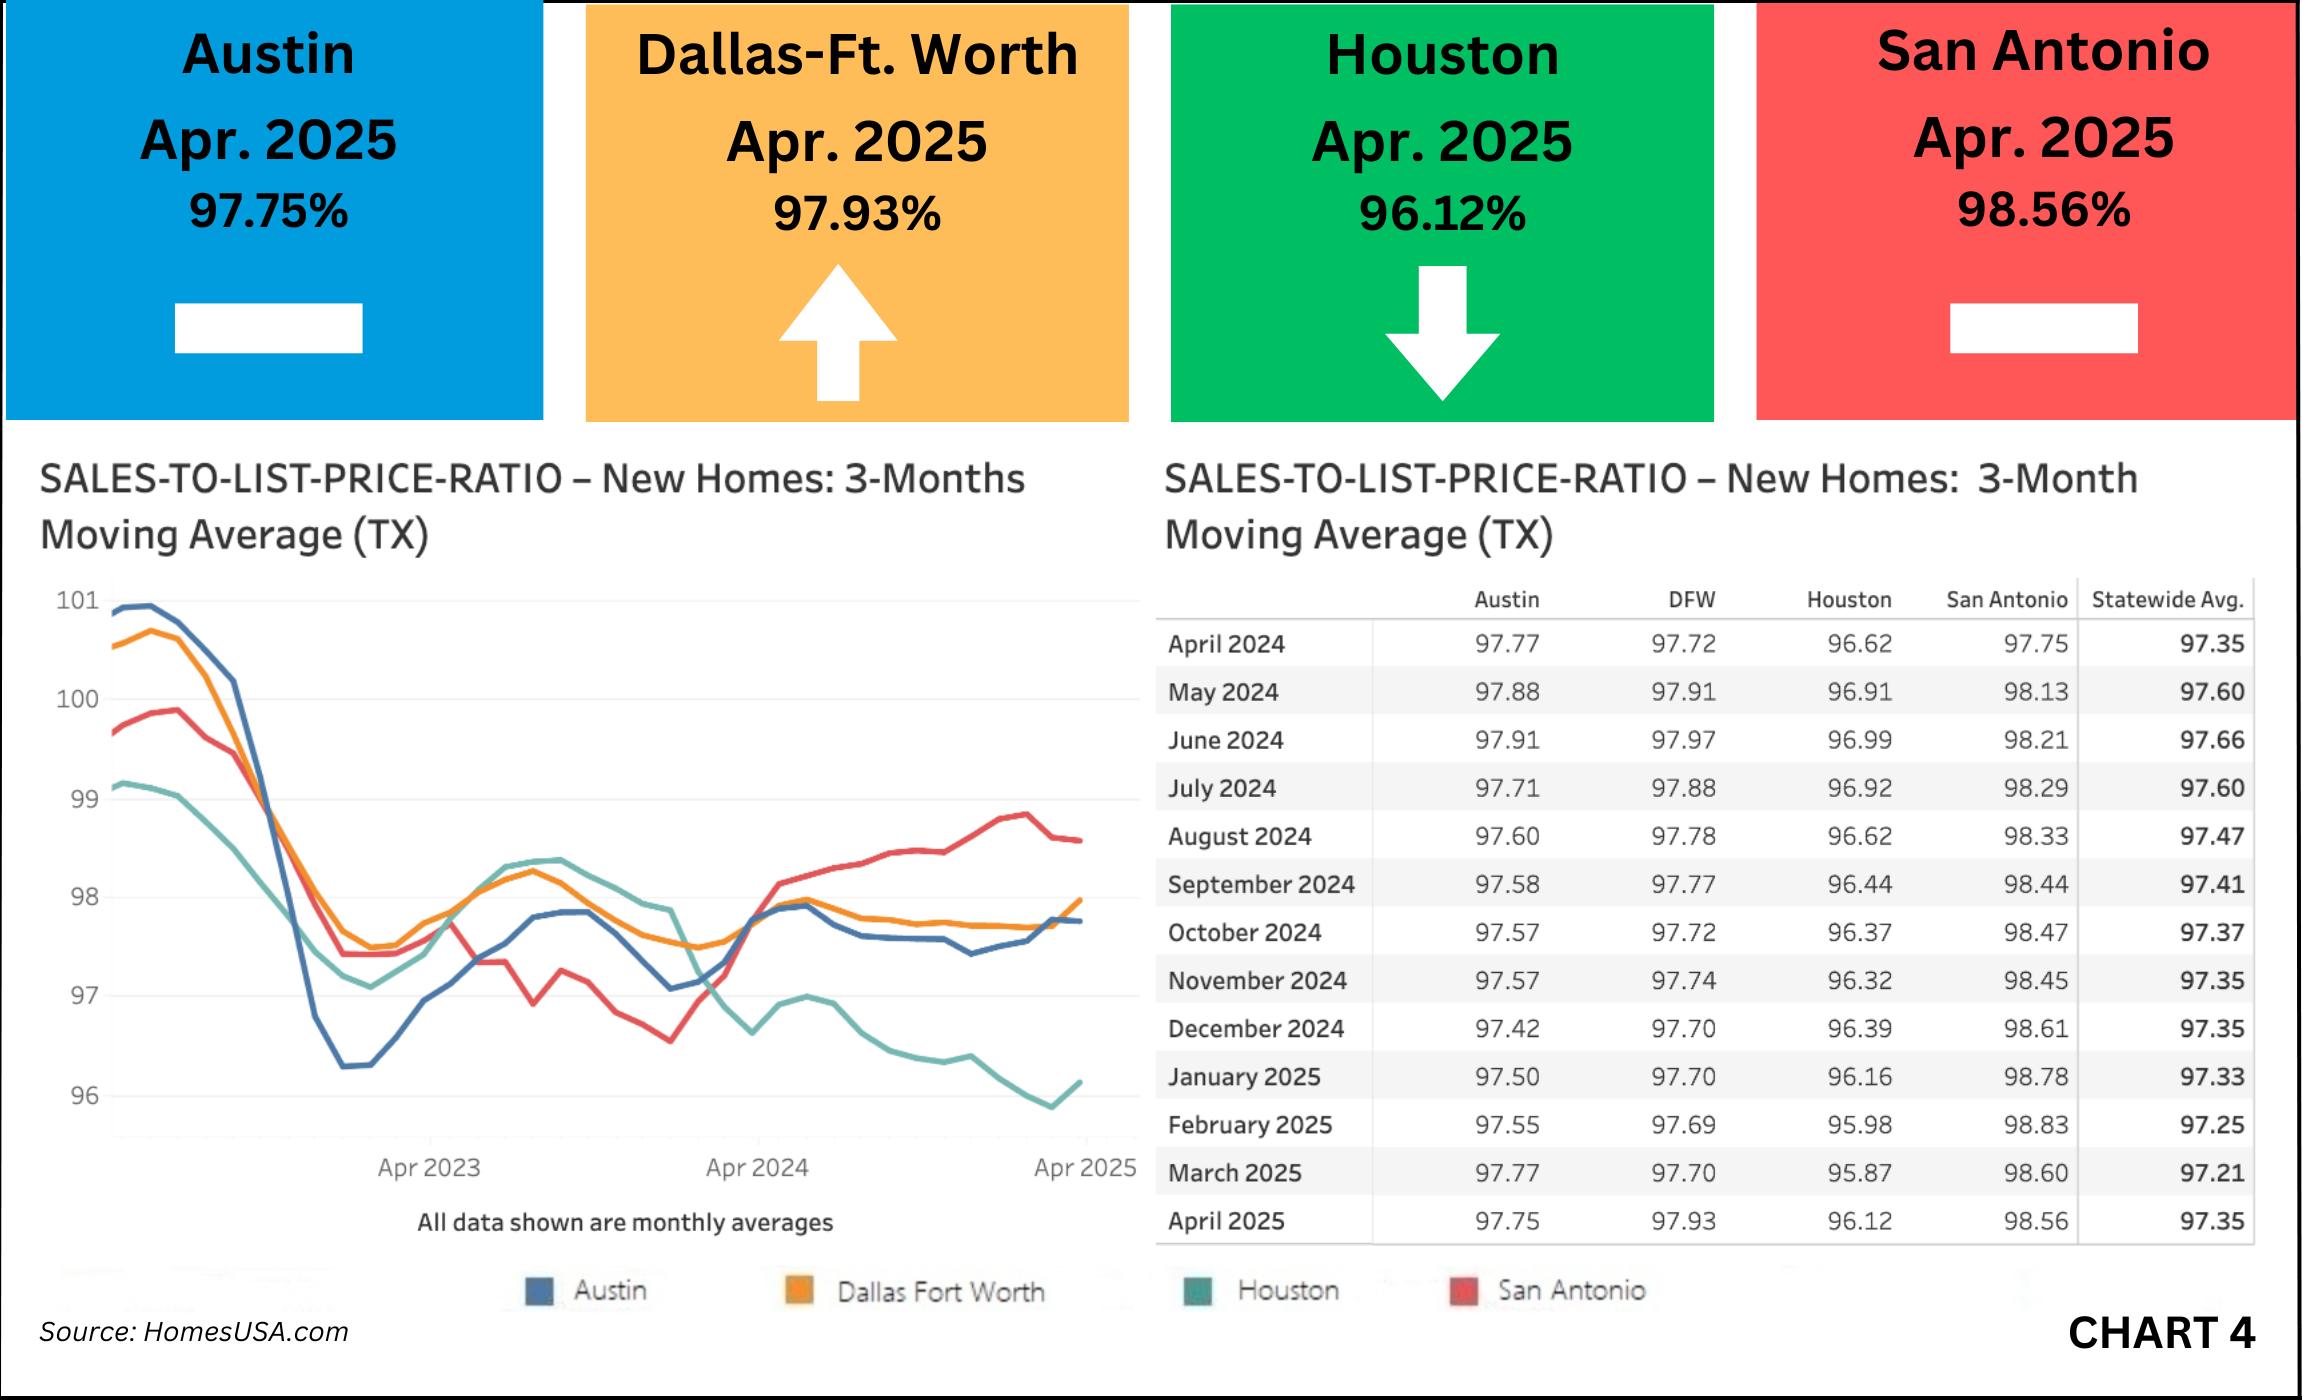
Texas Sales-to-List Price Ratio Remains Stable
Cumulative new home sales remain slightly lower than 100 percent of the asking price. The combined 3-month moving average of the sales-to-list price ratio in Texas’ four largest markets for April was 97.35, the same percentage it was a year ago, and was 97.21 percent last month. Dallas-Ft. Worth’s ratio in April was 97.93 versus 97.72 percent a year ago and 97.70 percent last month. In Houston, the ratio in April was 96.12 versus 96.62 percent a year ago and 95.87 percent last month. In Austin, the sales-to-price ratio in April was 97.75 versus 97.77 percent a year ago and 97.77 percent last month. San Antonio's ratio in April was 98.56 versus 97.75 percent a year ago and 98.60 percent last month. (See Chart 4: Texas Sales-to-List Price Ratio)
Texas Pending New Homes Sales Increase
Based on local MLS data, the 3-month average of pending new home sales continued to increase in the four largest Texas new home markets. The combined four-market average in April totaled 7,400 versus 6,965 in March. In Dallas-Ft. Worth, pending new home sales last month were 2,681 versus 2,534 in March. In Houston, pending new home sales in April were higher at 2,317 versus 2,162 in March. In Austin, pending new home sales in April increased to 1,244 versus 1,186 in March. In San Antonio, pending new home sales also increased last month to 1,157 versus 1,083 in March. (See Chart 5: Texas Pending New Home Sales)
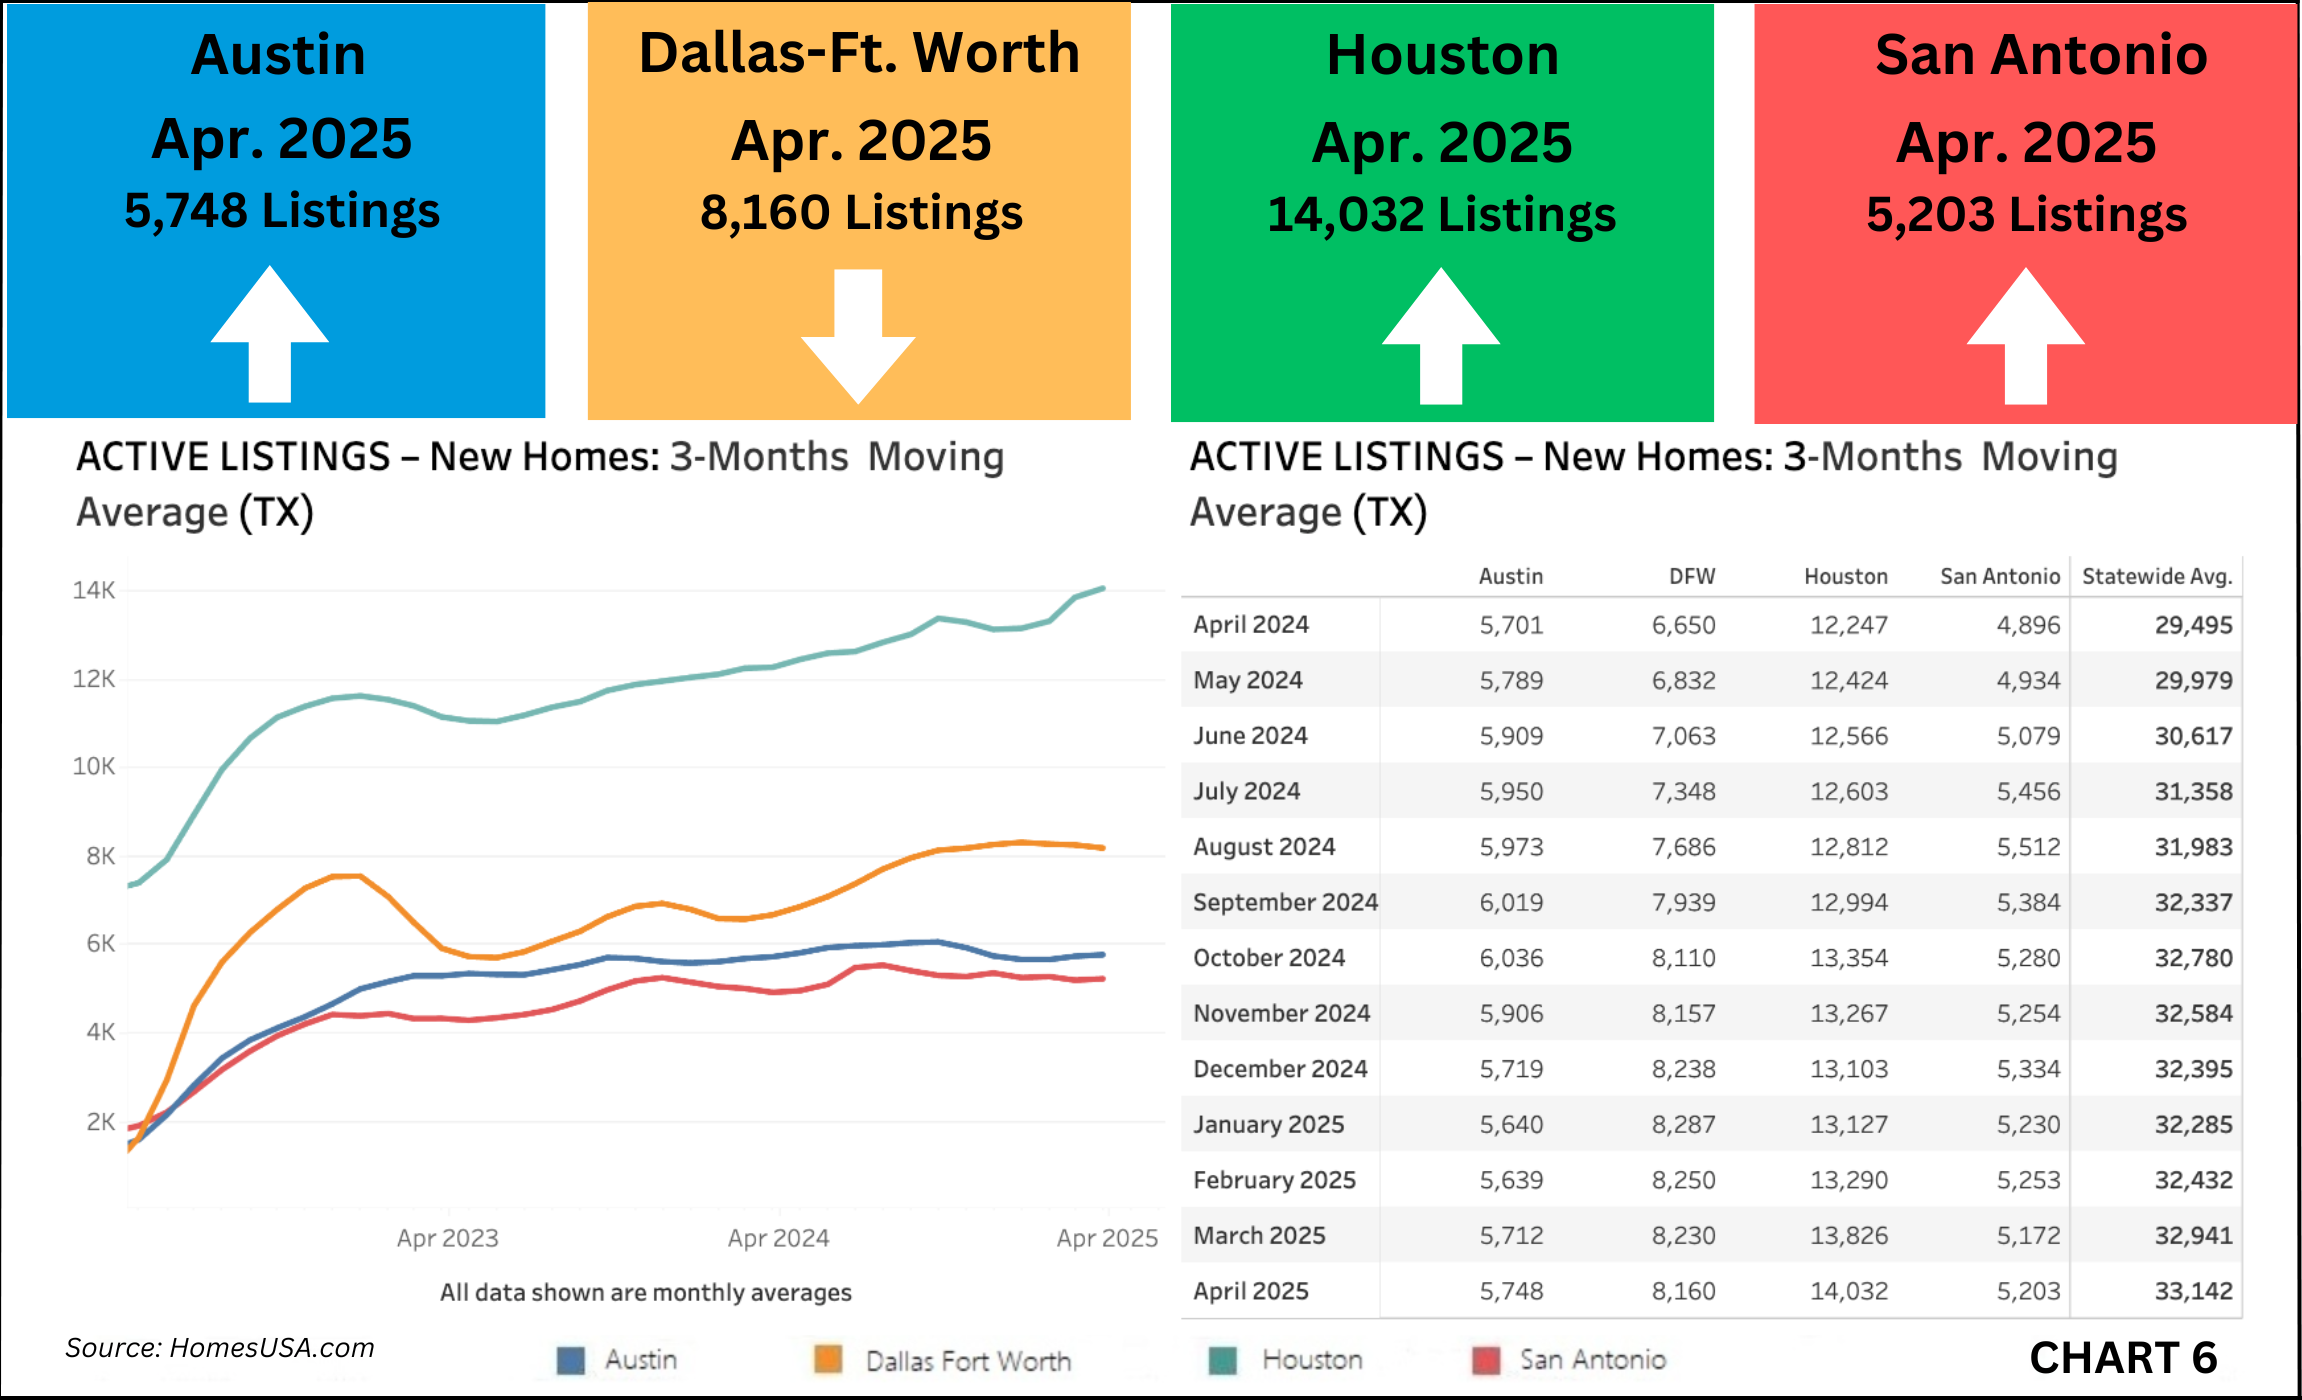
Texas Active Listings for New Homes Flatten
Active new home listings flattened in three of the four of the largest Texas new home markets in April. The April 3-month average active listings inventory in Texas’ four major new home markets was 33,142 new homes versus 32,941 in March. Dallas-Ft. Worth's active listings in April were 8,160 versus 8,230 in March. In Austin, active listings in April were 5,748 versus 5,712 in March. In San Antonio, active listings last month were 5,203 versus 5,172 in March. Houston was the anomaly, as active listings last month increased to 14,032 versus 13,826 in March. (See Chart 6: Texas Active Listings)
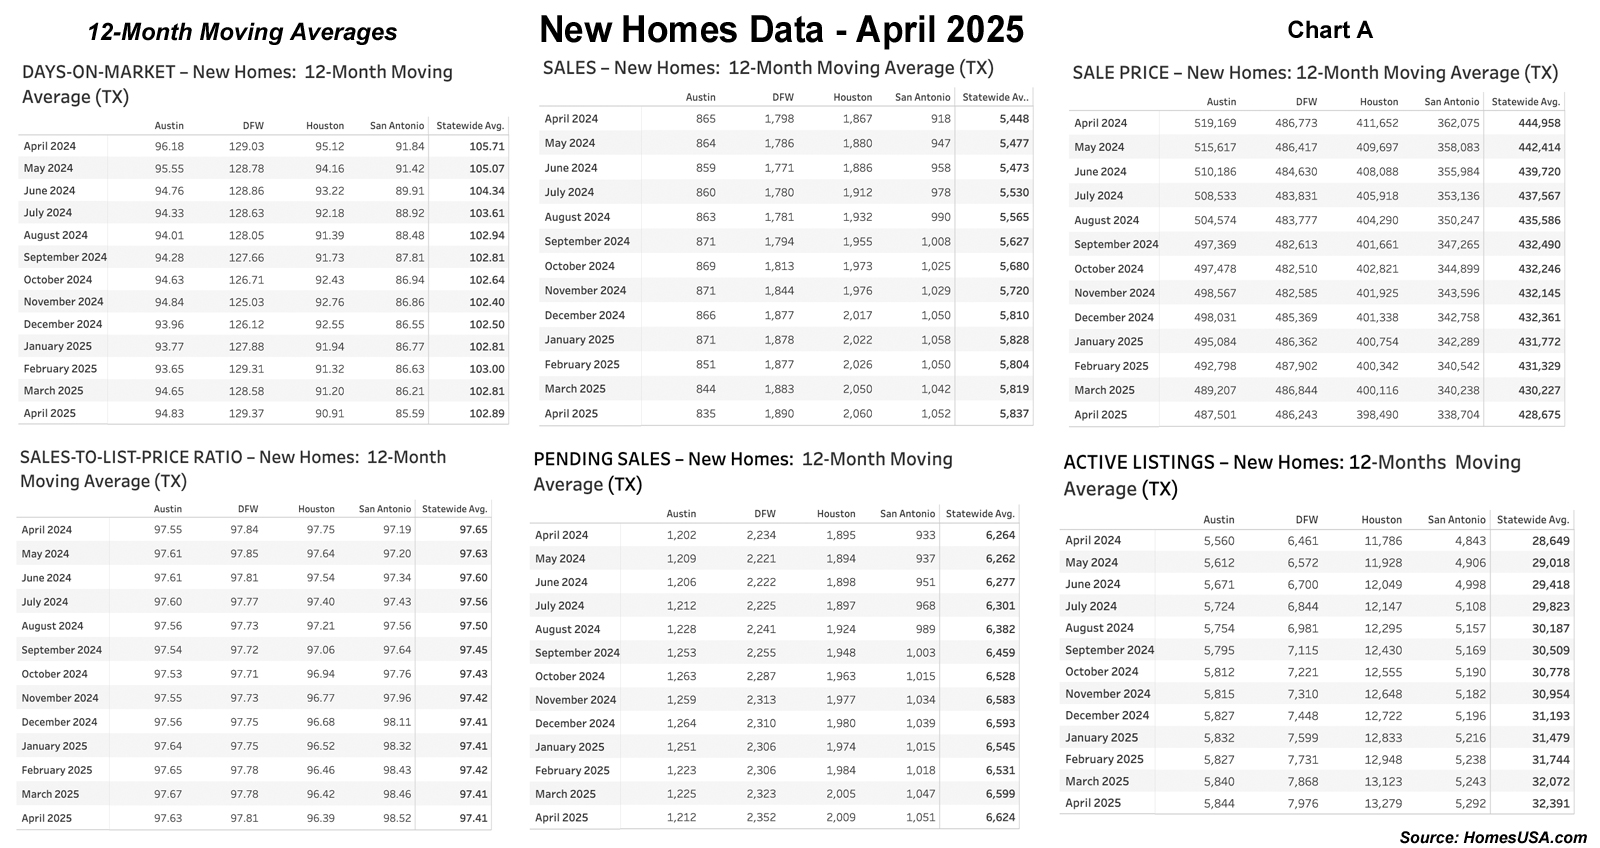
About the HomesUSA.com New Home Sales Index
The HomesUSA.com Index is reported as both a 3-month and 12-month moving average of the Days on Market for new homes listed in the local Multiple Listing Services (MLSs) for Dallas-Ft. Worth, Houston, Austin, and San Antonio. Created by Ben Caballero, it is the first Days on Market index to track the Texas new home market and includes homes listed while under construction. (See Chart A: 12-Month Moving Averages)
*Note: Texas data denotes a combination of its four largest new home markets – Houston, Dallas-Ft. Worth, Austin, and San Antonio – which comprise the vast majority of new home sales and MLS data statewide.
About Ben Caballero and HomesUSA.com®
Ben Caballero, founder and CEO of HomesUSA.com, is a three-time Guinness World Records title holder for ‘Most annual home sale transactions through MLS by an individual sell-side real estate agent – current.’ Ranked by REAL Trends as America’s top real estate agent for home sales since 2013, Ben is the most productive real estate agent in U.S. history. He is the only individual real estate agent to exceed $3 billion in residential sales transactions in a single year (2022), the first agent to exceed $2 billion (2018, 2019, 2020), and the first agent to exceed $1 billion (2015, 2016, 2017). Ben, an award-winning innovator and technology pioneer, works with more than 60 home builders in Dallas-Fort Worth, Houston, Austin, and San Antonio. His podcast series is available widely, including iTunes, Spotify and YouTube. Learn more at HomesUSA.com |Twitter: @bcaballero - @HomesUSA | Facebook: /HomesUSAdotcom.
Note for journalists: You may contact Ben Caballero directly by email at ben@homesusa.com.
REALTOR® is a federally registered collective membership mark which identifies a real estate professional who is a member of the NATIONAL ASSOCIATION OF REALTORS® and subscribes to its strict Code of Ethics.
Media Contact:
Kevin Hawkins
(206) 866-1220
kevin@wavgroup.com
Image: Ben Caballero (2025 – Updated)
https://bit.ly/ben-caballero-photo
Individual Chart images:
Chart 1: Texas New Homes Tracking – Days on Market – April 2025: https://homesusa.com/wp-content/uploads/2025/05/Chart-1-Texas-New-Homes-Tracking-Days-on-Market.png
Chart 2: Texas New Home Sales Market – April 2025: https://homesusa.com/wp-content/uploads/2025/05/Chart-2-Texas-New-Home-Sales-Market.png
Chart 3: Texas New Home Sales Prices Market – April 2025: https://homesusa.com/wp-content/uploads/2025/05/Chart-3-Texas-New-Home-Sales-Prices-Market.png
Chart 4: Texas Sales-to-List-Price Ratio Market – April 2025: https://homesusa.com/wp-content/uploads/2025/05/Chart-4-Texas-Sales-to-List-Price-Ratio-Market.png
Chart 5: Texas Pending New Home Sales Market – April 2025: https://homesusa.com/wp-content/uploads/2025/05/Chart-5-Texas-Pending-New-Home-Sales-Market.png
Chart 6: Texas Active Listings for New Home Market – April 2025: https://homesusa.com/wp-content/uploads/2025/05/Chart-6-Texas-Active-Listings-for-New-Homes-Market.png
Chart A: Texas 12-Month Moving Averages Market – April 2025: https://homesusa.com/wp-content/uploads/2025/05/Chart-A-12MonthChart-DataOnly.jpg
